Matplotlib

Contenido
Matplotlib
import numpy as np
import matplotlib.pyplot as plt
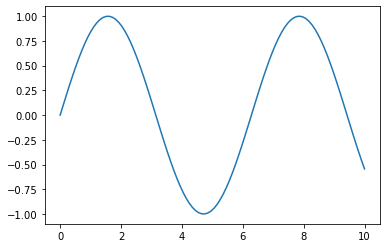
x = np.linspace(0,10,100)
plt.plot(x, np.sin(x))
plt.show()

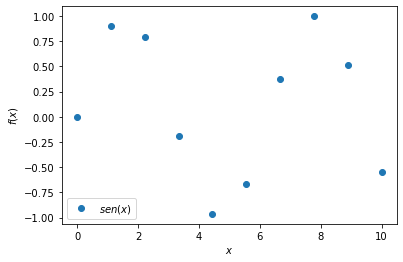
x = np.linspace(0, 10, 10)

plt.plot(x, np.sin(x), label=(r'$sen(x)$'), linestyle='', marker='o')

plt.ylabel(r'$f(x)$')
plt.xlabel('$x$')

plt.legend(loc='best')
plt.show()
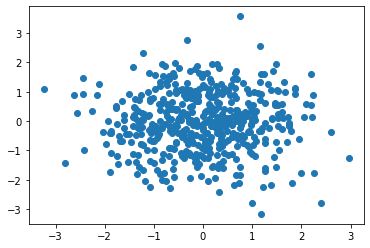
rng = np.random.RandomState(123)
x = rng.normal(size=500)
y = rng.normal(size=500)


plt.scatter(x, y)
plt.show()
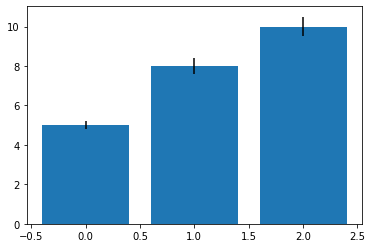
means = [5, 8, 10]
stddevs = [0.2, 0.4, 0.5]
bar_labels = ['bar 1', 'bar 2', 'bar 3']


# plot bars
x_pos = list(range(len(bar_labels)))
plt.bar(x_pos, means, yerr=stddevs)

plt.show()
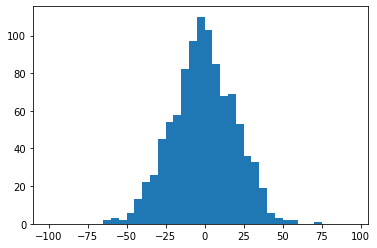
rng = np.random.RandomState(123)
x = rng.normal(0, 20, 1000)

# fixed bin size
bins = np.arange(-100, 100, 5) # fixed bin size

plt.hist(x, bins=bins)
plt.show()
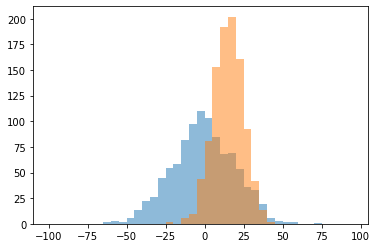
rng = np.random.RandomState(123)
x1 = rng.normal(0, 20, 1000)
x2 = rng.normal(15, 10, 1000)

# fixed bin size
bins = np.arange(-100, 100, 5) # fixed bin size

plt.hist(x1, bins=bins, alpha=0.5)
plt.hist(x2, bins=bins, alpha=0.5)
plt.show()
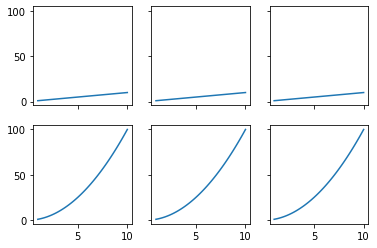
x = np.linspace(1,10)

fig, ax = plt.subplots(nrows=2, ncols=3,
                       sharex=True, sharey=True)

conta = 1
for row in ax:
    for col in row:
        col.plot(x, x**(conta))
    conta += 1

plt.show()
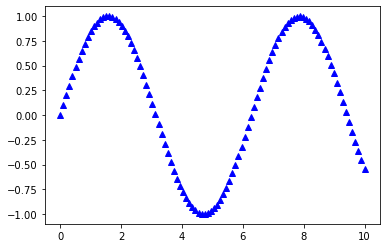
x = np.linspace(0, 10, 100)
plt.plot(x, np.sin(x),
         color='blue',
         marker='^',
         linestyle='')
plt.show()
x = np.linspace(0, 10, 100)
plt.plot(x, np.sin(x))

plt.savefig('mi_figura.png', dpi=300)
plt.savefig('mi_figura.pdf')

plt.show()